Whenever I create a new ASP.NET website, MiniProfiler is one of the first NuGet packages that I download. MiniProfiler is like Dapper, a library offered by StackExchange, the owner of StackOverflow.
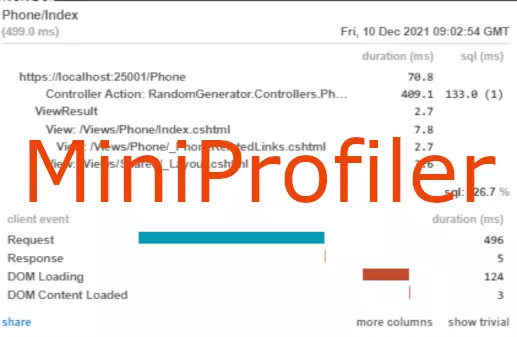
This library gives me insights into how much time it takes to make a request. It shows you the trace of the execution thread and other insights that can help me find bugs and improve the application.
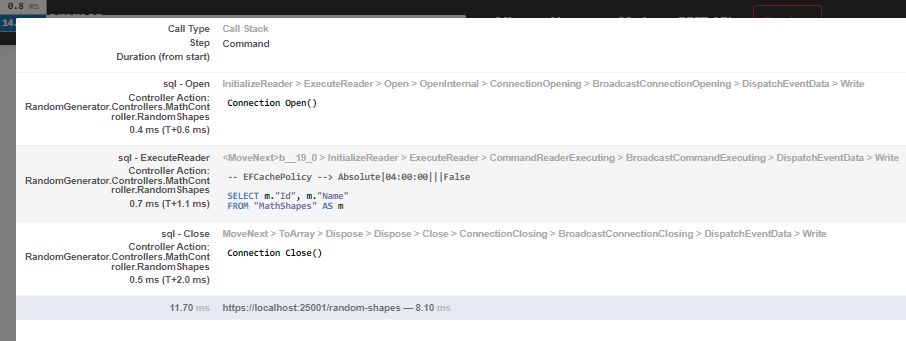
You can also see the SQL queries even if you use EntityFrameorkw, Linq2SQL, or Dapper. MiniProfiler will show you how much time it takes to execute a query. It often happens to me to see the actual query of an Entity Framework statement and to identify bugs.
When I want to analyze a website’s performance, I first need to install MiniProfiler.
How to install MiniProfiler in ASP.NET Core and Entity Framework
The first step is to install the NuGet packages:
Install-Package MiniProfiler.AspNetCore.Mvc
Install-Package MiniProfiler.EntityFrameworkCore
Then edit the Startup.cs file to configure the service and the middleware:
public class Startup
{
    private readonly IWebHostEnvironment _env;
    public IConfiguration Configuration { get; }

    public Startup(IConfiguration configuration, IWebHostEnvironment environment)
    {
        Configuration = configuration;
        _env = environment;
    }

     public void ConfigureServices(IServiceCollection services)
     {
           // Other services
        if (_env.IsDevelopment())
        {
            services.AddMiniProfiler().AddEntityFramework();
        }
     }

    public void Configure(IApplicationBuilder app, IWebHostEnvironment env)
    {
       // other middlewares
        if (env.IsDevelopment())
        {
            app.UseMiniProfiler();
        }
        app.UseRouting();

        app.UseEndpoints(endpoints =>
        {
            endpoints.MapControllerRoute(
                name: "default",
                pattern: "{controller=Home}/{action=Index}/{id?}");

            endpoints.MapRazorPages();
        });
    }
}
After, add the tag helpers in _ViewImports.cshtml:
@using StackExchange.Profiling
@addTagHelper *, MiniProfiler.AspNetCore.Mvc
The last step is to add the mini profiler component to the _Layout.cshtml file. I usually add it after the footer tag.
<environment include="Development">
    <mini-profiler />
</environment>
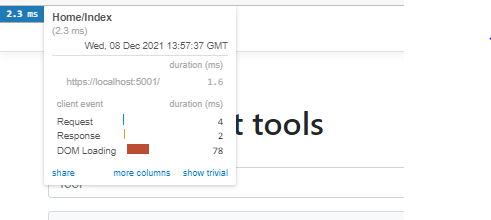
Now when you run the application, you will see a little window will show in the left part of your website:


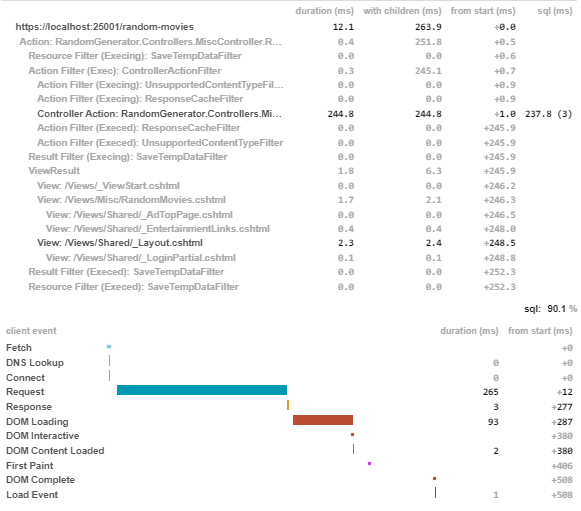
You can see how much time each call takes. For example, in the below example, I can see that SQL took 90% of the time:


3 thoughts on “MiniProfiler – ASP.NET Core and Entity Framework Profiler”